The Oil Majors: Strong EPS, Strong Returns — but Is the Business Getting Stronger?

Two oil majors reporting similar earnings per share, dividend yields and apparently respectable shareholder returns may look the same, but their overall performance can still be fundamentally different.
One may be growing in value, and therefore increasing its future earning capacity, while still paying shareholders returns that are competitive with its peers. Another may be doing the opposite: appearing to compete by generating enough cash to support dividends and buybacks, but with little evidence that the underlying business itself is becoming more valuable.
The distinction is huge, but surprisingly easy to miss because oil company analysis tends to concentrate on the immediate numbers: earnings, free cash flow, dividends and buybacks. These measures are important, but they do not tell us whether a company is compounding value over time.
By their nature, the majors are mature businesses. As with any healthy mature business, they are expected to produce significant amounts of cash from a large existing asset base. For oil majors, when commodity prices are supportive, management can return some of that cash through dividends and use more to repurchase shares. As the share count falls, the same level of company earnings is divided among fewer shares. Earnings per share can therefore improve even when aggregate earnings do not.
Another company can also generate cash and return it to shareholders while continuing to invest successfully in new production, resources, projects and acquisitions that expand its future earnings capacity. Its share count may fall more slowly, or even rise temporarily following an acquisition, but the value of the company itself continues to grow. The first company may still be a good investment. The second is doing something more difficult.
The evidence from the oil majors suggests that both models exist.
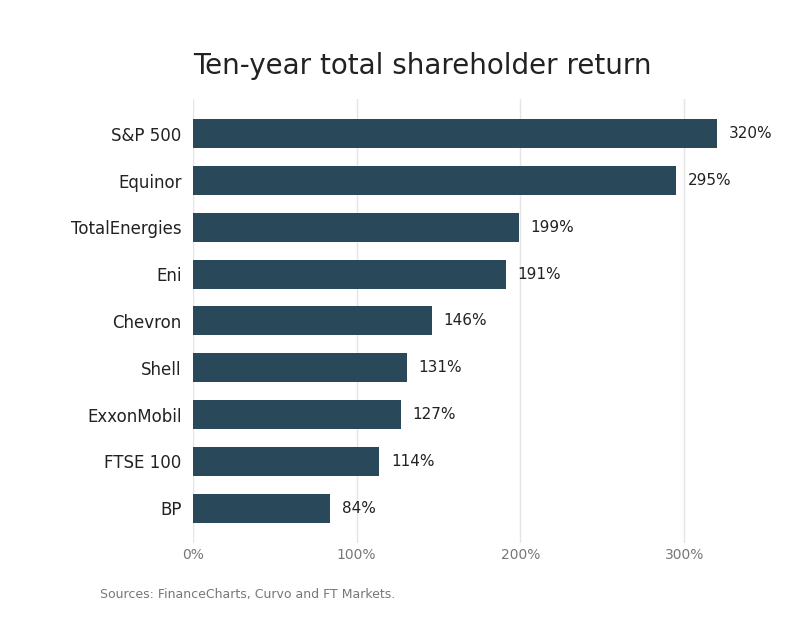
CHART 1: TEN-YEAR TOTAL SHAREHOLDER RETURN — OIL MAJORS, FTSE 100 TOTAL RETURN AND S&P 500 TOTAL RETURN
Looking at the chart, long-term shareholder returns do not reveal an obvious divergence between the majors. Across ExxonMobil, Chevron, Shell, BP, TotalEnergies, Eni and Equinor, shareholders have generally received substantial returns over the past decade. Dividends have played an important role, as have buybacks and, in several cases, meaningful share-price appreciation.
The 10-year TSR chart alone also does not support a simple argument that American oil companies succeeded while European companies failed, although any divergence associated with differing ESG policies is likely to be partly obscured by the long timeframe. Equinor, TotalEnergies and Eni have delivered strong total shareholder returns over the period examined. Chevron has also performed strongly, while ExxonMobil and Shell have generated respectable returns. BP has been the clear laggard of the group, but even BP shareholders have received a positive return once dividends are included.
The picture changes when those returns are placed beside the broader equity markets. The FTSE 100 provides useful context for BP and Shell because it tests whether poor or mediocre returns were simply a consequence of being listed in London during a weak period for UK equities. The comparison suggests otherwise. Shell appears to have outperformed the FTSE 100 on a total-return basis, while BP appears to have underperformed it.
The two companies operated in much the same equity-market environment and were exposed to many of the same commodity-price cycles. That makes the divergence particularly interesting because it suggests company-specific performance played an important role. Intuition points towards factors such as Macondo and Rosneft in BP’s case, but more detailed work would be needed before attributing the gap to particular decisions or events.
The S&P 500 provides a harder test. It is not a peer benchmark for an oil company and should not be treated as one. Its sector composition is very different and its performance over the past decade was heavily influenced by technology and other high-growth businesses. Even so, it represents a genuine opportunity cost for capital, although whether that comparison should be adjusted for differences in risk and sector exposure is a separate question.
With hindsight, an investor choosing Exxon or Chevron over the broad US market accepted commodity exposure, cyclicality and the capital intensity of oil and gas. It is therefore reasonable to ask whether the return justified that choice.
Taken together, the initial 10-year TSR analysis suggests that none of the seven majors matched the S&P 500 over the decade. That does not make them poor investments, but it sets a higher bar for any claim that an oil major is genuinely compounding shareholder wealth.
A company can be a strong compounder relative to other oil companies while still falling short of the broader market. Exxon and Chevron may be among the better examples of companies that can return cash while growing the business, but that does not mean they have compounded shareholder wealth at the rate achieved elsewhere in the equity market.
This may be less a criticism of individual management teams than a clue to something structural about the industry. Oil and gas companies operate with depletion built into the business model. Production today reduces the resource base available for production tomorrow. Before a company can grow, it must first replace what it has produced. Large amounts of money therefore have to be reinvested simply to stand still, making a high current earnings yield less informative than it can first appear.
A shareholder return is not the same as a growing company
A shareholder can make money from a company that does not grow. There is nothing inherently wrong with this. Mature businesses exist to produce cash for their owners, and a company with limited reinvestment opportunities may create more value by returning excess cash than by forcing money into poor projects. The difference becomes important when similar per-share measures conceal very different underlying outcomes. Over the period examined, the market value of the seven majors developed very differently.
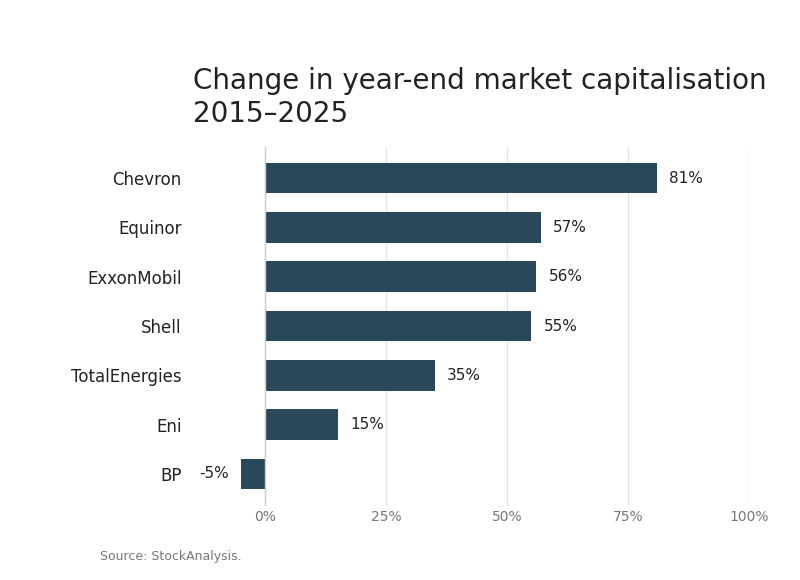
CHART 2: CHANGE IN YEAR-END MARKET CAPITALISATION, 2015–2025
Chevron's aggregate equity value increased substantially. ExxonMobil also ended the period considerably more valuable than it began, while Shell's market capitalisation grew despite a very large reduction in shares outstanding. At the other end of the group, BP's aggregate equity value ended the period around where it began, despite ten years of dividends, buybacks, investment, asset sales and major strategic change.
Eni generated strong shareholder returns but with much more modest growth in the total value of the company. TotalEnergies sits somewhere between the two groups, with strong shareholder returns and meaningful, although less dramatic, growth in aggregate equity value.
This begins to expose the difference between generating a return and building a more valuable business. An oil company can satisfy shareholders through a combination of current earnings yield and distributions without necessarily increasing the value of the underlying equity base. Another can pay shareholders and increase the value of the company at the same time. The distinction is not visible in a single year's EPS figure and is not captured properly by dividend yield alone.
The combination of market capitalisation growth and shareholder distributions is therefore important. It helps show whether shareholders were paid from a business that became more valuable, or whether most of the return came from harvesting and redistribution.
The shrinking denominator
Share buybacks have become central to the financial model of the oil majors. The industry generated exceptional cash flows through the post-pandemic commodity cycle, and many companies returned large amounts of that cash through repurchases.
Buybacks can create real value. A company repurchasing undervalued shares increases the ownership percentage of remaining shareholders and can improve per-share economics materially. But they also complicate comparisons because they can make a static business look better on a per-share basis. EPS and cash flow per share can rise simply because the denominator is shrinking, even if aggregate earnings and the value of the company are not growing.
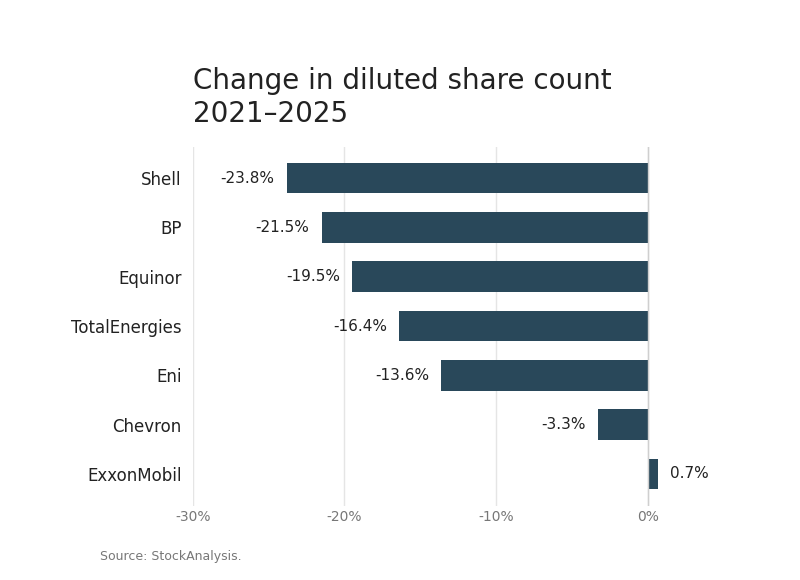
CHART 3: CHANGE IN DILUTED SHARE COUNT, 2021–2025
As the chart shows, the differences in share count are considerable. Several European majors have reduced their diluted share counts substantially. Shell's reduction has been particularly large, with diluted shares outstanding falling by almost a quarter between 2021 and 2025. BP has also removed more than a fifth of its diluted share count over the same period.
In both cases, this creates a significant mechanical uplift to per-share measures. Even if aggregate earnings were unchanged, EPS would rise simply because those earnings are being divided among fewer shares. The chart therefore reinforces why per-share growth has to be separated from growth in the earning power of the company itself.
ExxonMobil looks very different, with its diluted share count broadly stable over the period examined. This partly reflects the Pioneer Natural Resources acquisition, which was funded with Exxon shares and therefore increased the number of shares outstanding.
The significance becomes obvious with a simple example. Suppose a company earns $10 billion and has one billion shares. It earns $10 per share. If company earnings remain unchanged but the share count falls to 800 million, EPS rises to $12.50. The remaining shareholder is genuinely entitled to a larger share of the company, but the company still earns $10 billion.
Now compare that with a company whose share count remains at one billion but whose earnings capacity grows from $10 billion to $12.5 billion. Both companies now report EPS of $12.50, but the identical per-share result has been created in two completely different ways. One company has redistributed ownership of a largely unchanged earnings stream among fewer shareholders. The other has increased the earnings stream itself.
Most oil majors will fall somewhere between these two theoretical extremes. Their per-share performance will reflect some combination of business growth, cost reduction, portfolio change, acquisitions and buybacks. The balance between them is what matters.
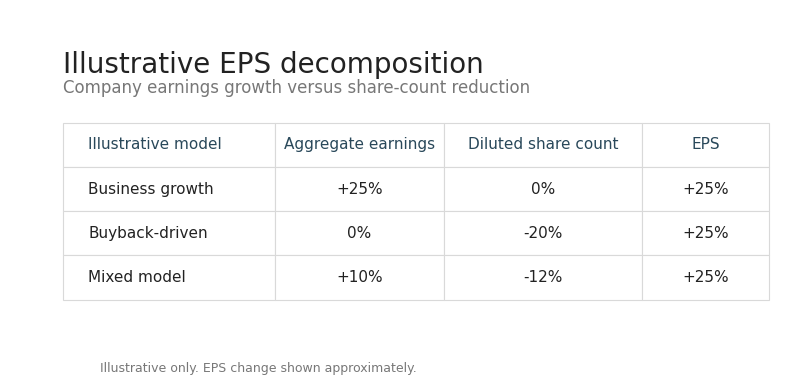
TABLE 1: ILLUSTRATIVE EPS DECOMPOSITION — COMPANY EARNINGS GROWTH VERSUS SHARE-COUNT REDUCTION
This is one reason why simple EPS comparisons can mislead. The first stage of the analysis suggests that part of the European per-share story has occurred against a rapidly shrinking denominator. That does not make the improvement artificial, but it does mean the sources of that improvement need to be separated before conclusions are drawn about the quality of the underlying business.
Exxon and the problem of growing at scale
ExxonMobil is an important test case because its recent strategy has required it to do more than protect an existing earnings base. The company has invested heavily in Guyana, expanded its Permian position and completed the acquisition of Pioneer Natural Resources. These decisions involved large amounts of money and, in the case of Pioneer, the issuance of shares.
It is not enough for Exxon to report higher aggregate earnings after buying a large company. A larger company should earn more money. The more difficult question is whether Exxon can improve the economics of the enlarged asset base and produce stronger results for each share over time. The early comparison is useful because Exxon's equity value has grown materially while its share count has not been reduced at anything like the rate seen at several European majors. In broad terms, Exxon has had to make the numerator work.
Its recent strategy is built around the proposition that investment in advantaged resources can increase the future earning capacity of the company while still allowing large shareholder distributions. Guyana, the Permian and Pioneer all have to contribute to that outcome. This does not automatically prove superior value creation. Commodity prices matter, acquisition timing matters and the future delivery of the Pioneer transaction matters. Guyana also increases the importance of an exceptional asset within the group portfolio.
Scale makes the test harder still. The larger a company becomes, the more absolute earnings growth it must generate simply to maintain the same percentage growth rate. For a company of Exxon’s size, even a successful project may be too small to move group earnings materially. This is part of the attraction of Guyana and the Permian: both offer sufficient scale and repeatability to influence the economics of the whole company. The financial model is therefore different from one based primarily on reducing the number of claims against a static or slowly growing earnings base.
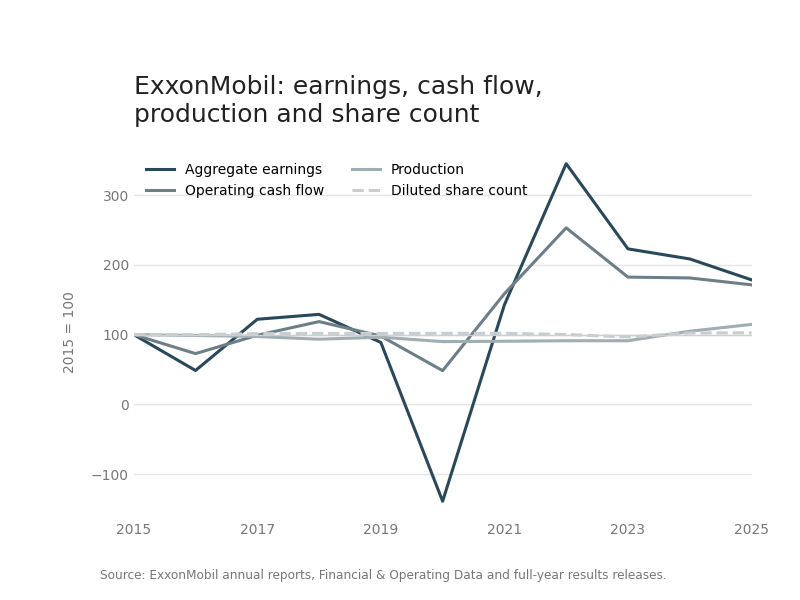
CHART 4: EXXON — AGGREGATE EARNINGS, OPERATING CASH FLOW, PRODUCTION AND SHARE COUNT, INDEXED TO 100
Chevron may be the cleanest comparator
Chevron may provide an even cleaner example of the question. Over the period examined, it has combined shareholder distributions with substantial growth in aggregate equity value. Its share-count reduction has been much less aggressive than that of several peers.
Chevron's development has not been smooth. Its share price history reflects the commodity cycle, major project execution, portfolio questions and the long delay surrounding the Hess transaction. That is partly why the company is useful. Compounding in oil and gas does not mean a smooth upward line. This is a cyclical, capital-intensive and depleting industry, and companies continually have to replace production and future resources before they can claim genuine growth.
The relevant question is whether, through the cycle, a company can distribute cash while building a more valuable equity base. The first-pass evidence suggests Chevron has done this more successfully than many peers.
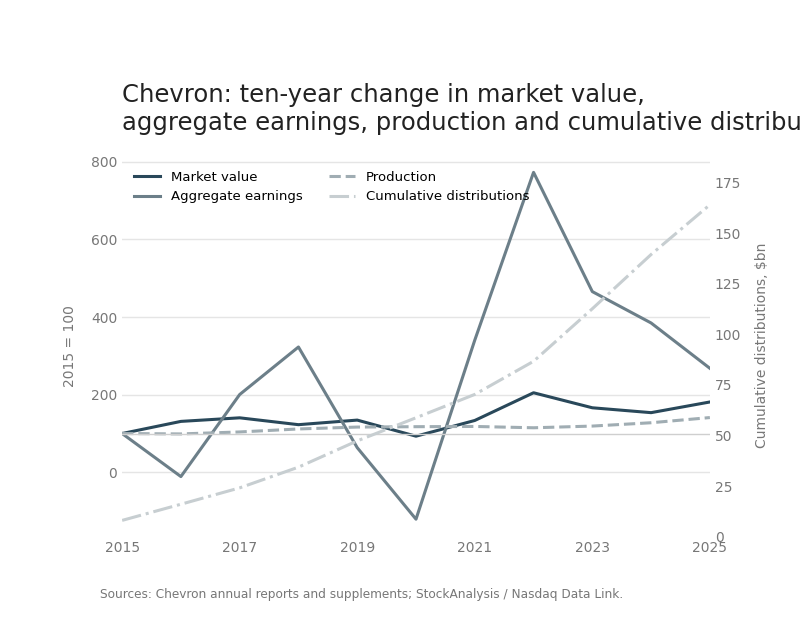
CHART 5: CHEVRON — TEN-YEAR CHANGE IN MARKET VALUE, AGGREGATE EARNINGS, PRODUCTION AND CUMULATIVE DISTRIBUTIONS
The S&P comparison adds perspective. Chevron's outcome may look strong against other majors and less impressive against the broader equity market. That does not weaken the oil-company comparison. It tells us that the bar for true compounding should be higher than simply outperforming weaker sector peers.
Shell complicates the simple story
Shell is probably the most interesting challenge to any simple US-versus-Europe conclusion. The company has reduced its share count very substantially, providing a powerful tailwind to per-share measures, but it has also increased its aggregate equity value over the period examined. That combination can be particularly powerful for remaining shareholders: a more valuable company divided among materially fewer shares.
The analytical question is therefore different from the one facing BP. With Shell, we need to determine how much per-share improvement has come from genuine growth or improvement in the earning power of the business, and how much has come from share-count reduction. Its LNG position, portfolio restructuring, disposals, investment choices and changing exposure to refining and chemicals will all affect the answer.
Shell may ultimately prove to be a hybrid model rather than a pure growth company or a simple harvesting business. It may be capable of improving the portfolio, returning substantial cash and reducing the share count without allowing the value of the whole company to stagnate. That would distinguish it from a company where buybacks are doing most of the work.
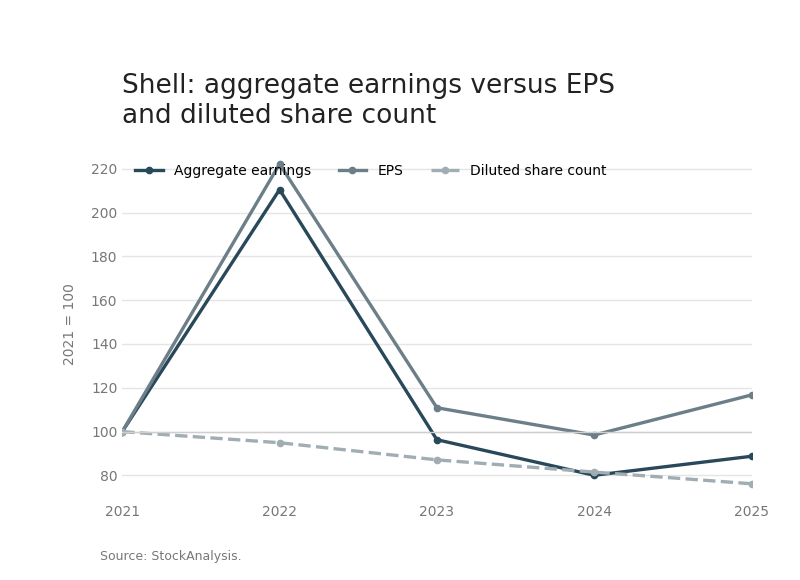
CHART 6: SHELL — AGGREGATE EARNINGS VERSUS EPS VERSUS SHARE COUNT
BP and the stagnation problem
BP is the clearest case for examining whether shareholder yield can coexist with company stagnation. The company has paid dividends, repurchased shares, invested in new businesses, developed upstream projects, sold assets and repeatedly changed strategic direction. Yet its aggregate equity value at the end of the period remained around its starting level.
This is difficult to dismiss as a consequence of weak UK markets alone. Shell faced much of the same London market environment and produced a materially better shareholder outcome, giving BP’s result a more company-specific character. That does not mean the two companies began from identical positions. BP carried the long financial and strategic consequences of Macondo, while the later loss of Rosneft removed a major source of earnings and value from the group.
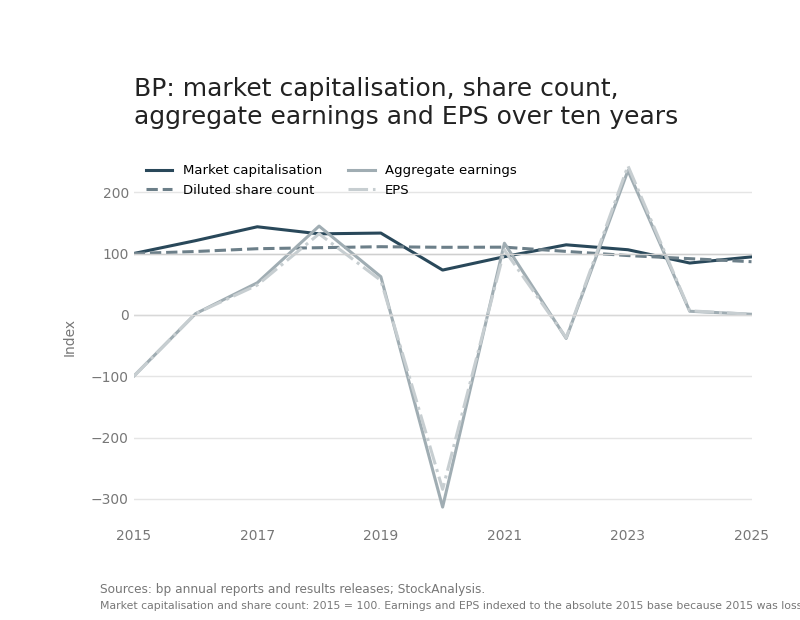
CHART 7: BP — MARKET CAPITALISATION, SHARE COUNT, AGGREGATE EARNINGS AND EPS OVER TEN YEARS
Even allowing for those factors, the longer-term result remains difficult to ignore. The key question for BP is not simply whether it can generate a respectable quarterly EPS number or maintain competitive distributions. It is whether the cash retained inside the company ultimately creates a more valuable business. A company can spend billions every year without compounding. Investment alone is not evidence of growth, and acquisitions, new projects or strategic initiatives only create value when the resulting business is worth more than the cash and opportunity cost required to build it.
At BP, the market’s long-term judgement has been severe. The company has materially reduced its share count, which should support per-share economics, but the equity value of the whole company has failed to grow. This creates the possibility that per-share improvement can coexist with strategic stagnation.
The comparison with Exxon is revealing. Exxon has expanded its resource and production base while completing a major acquisition and maintaining a broadly stable share count over the shorter recent period examined. BP has materially reduced its share count, yet the value of the company has failed to compound over the longer period.
The comparison does not by itself establish causation because the companies started from different places, made different portfolio choices and carried different strategic legacies. But it frames the right question: which company is increasing the economic pie, and which is mainly changing the way the existing pie is divided?
Strong shareholder returns can still come from different models
The results for Eni, Equinor and TotalEnergies deserve careful treatment because all three have features that make quick comparisons dangerous.
Equinor's state ownership affects the free float and the way market capitalisation and distributions should be interpreted, while its exposure to European gas prices was particularly important during the energy crisis. TotalEnergies has built a differentiated position across oil, LNG and power while maintaining strong distributions and may prove to be another example where the market has rewarded a combination of current cash returns and confidence in future earnings capacity.
Eni has generated strong shareholder returns while pursuing a more structural approach to its portfolio, including the satellite model used for businesses such as Plenitude and Enilive. Its relatively modest aggregate equity-value growth should not be read without considering asset monetisation and value transferred into partly separated vehicles.
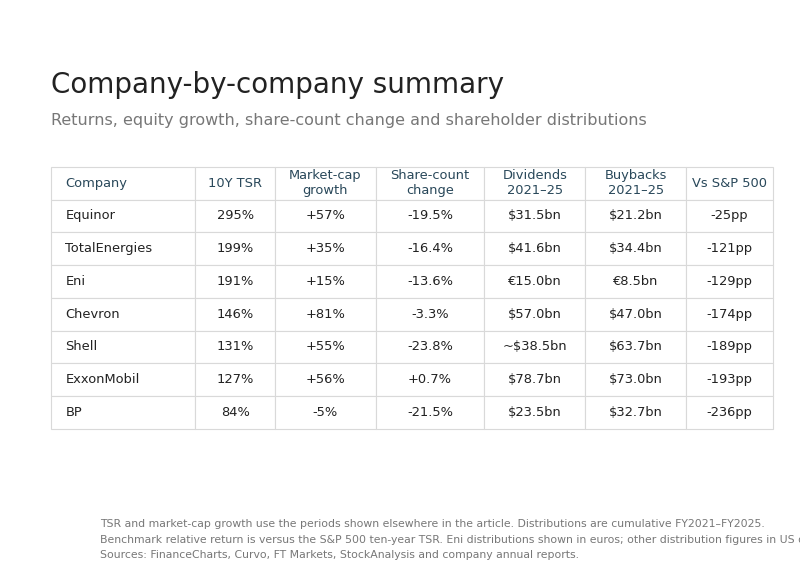
TABLE 2: COMPANY-BY-COMPANY SUMMARY — TSR, MARKET-CAP GROWTH, SHARE-COUNT CHANGE, DIVIDENDS, BUYBACKS AND BENCHMARK RELATIVE RETURN
A company that distributes assets, sells stakes or separates businesses may reduce the apparent growth of the parent while still creating value for shareholders. A company that retains everything inside the parent has to be judged differently. The analysis therefore has to follow where the value actually went.
What happened to the retained cash?
The next stage of the analysis is not simply to compare EPS growth. It is to examine what each company did with the cash that was not returned to shareholders. Over ten years, each major has spent enormous sums on capital expenditure, acquisitions and portfolio development. Some of that money was required simply to offset depletion.
Oil companies are unusual businesses in this respect. Production today reduces the asset base available for production tomorrow. A company can report strong current earnings while consuming the resources that support future cash flows. Maintaining production therefore requires continual reinvestment. Growth requires more.
This means conventional growth measures have to be treated carefully. Higher revenue caused by a higher oil price is not the same as increased earnings capacity. Higher production achieved through an expensive acquisition is not automatically evidence of value creation. Higher EPS generated by buybacks tells us something different from higher aggregate earnings. The right comparison has to put several measures together.
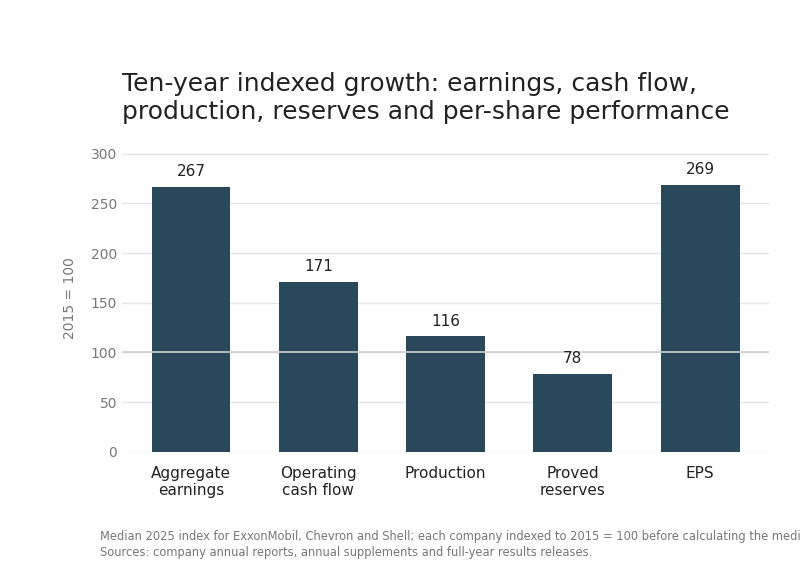
CHART 8: TEN-YEAR INDEXED GROWTH — AGGREGATE EARNINGS, OPERATING CASH FLOW, PRODUCTION, RESERVES AND PER-SHARE METRICS
For each company, the analysis needs to examine whether production grew, whether reserves were replaced, whether cash flow grew through the cycle, whether aggregate earnings capacity increased, how much the share count fell, how much cash was distributed and what happened to the value of the company. No single measure answers the question, but together they begin to show whether a company is genuinely compounding or primarily harvesting.
Competing and growing
An oil major that can only maintain a competitive earnings yield by limiting reinvestment and shrinking its share count faces a different future from one that can return cash and still expand its resource and earnings base. Both may look attractive in a strong commodity cycle, but the differences emerge over a full cycle.
The compounding company develops more choices. It can invest organically, make acquisitions, sell assets from a position of strength and continue returning cash. The stagnating company becomes increasingly dependent on the quality of its existing portfolio and the commodity environment.
There is also a broader challenge for the sector. Even the strongest oil majors appear to have struggled to match the compounding delivered by the S&P 500 over the past decade. That may reflect the extraordinary performance of the US equity market, but it may also expose a deeper feature of oil and gas: before growth begins, the industry has to spend heavily simply to replace what it produces.
The important comparison among the majors therefore has two levels. The first is whether a company can outperform its sector peers by returning cash while growing the value and future earning capacity of the business. The second is whether that process produces a return competitive with the broader equity market.
The initial evidence suggests the answers differ materially across the sector. Some oil majors appear capable of competing, distributing cash and growing the economic value of the business at the same time. Others look much closer to mature cash-return vehicles, where per-share improvement owes more to a shrinking denominator than to a growing company.